
https://stackoverflow.com/questions/21517020/in-mathematica-how-can-i-cut-off-the-high-order-terms-in-a-polynomial
In[1]:= y = a0 + a1*x + a2*x^2 + a3*x^3 + a4*x^4;
y /. x^b_ /; b >= 3 -> 0
Out[2]= a0 + a1 x + a2 x^2
https://stackoverflow.com/questions/21517020/in-mathematica-how-can-i-cut-off-the-high-order-terms-in-a-polynomial
In[1]:= y = a0 + a1*x + a2*x^2 + a3*x^3 + a4*x^4;
y /. x^b_ /; b >= 3 -> 0
Out[2]= a0 + a1 x + a2 x^2
numpy 行列(配列) array に対する操作
*行列の左右のみを反転させる.
numpy.fliplr(a)
http://docs.scipy.org/doc/numpy/reference/generated/numpy.fliplr.html
*転置行列
a.T
*行列形式のデータの表示
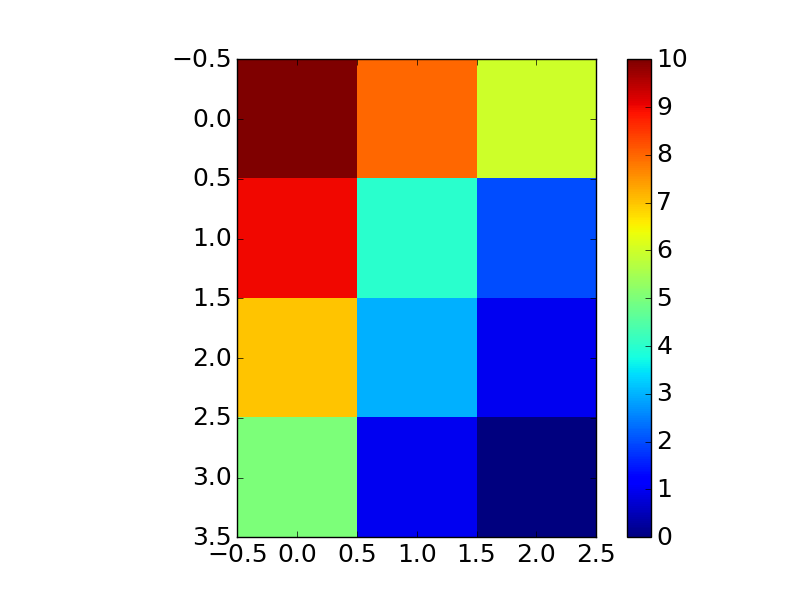
matplotlib.pyplot.imshow(a, interpolation=’nearest’)
|
1 2 3 4 5 6 7 8 9 10 11 12 13 14 15 16 17 18 19 20 21 |
import numpy as np a = np.array([[10, 8, 6], [ 9, 4, 2], [ 7, 3, 1], [ 5, 1, 0]]) np.fliplr(a) array([[ 6, 8, 10], [ 2, 4, 9], [ 1, 3, 7], [ 0, 1, 5]]) a.T array([[10, 9, 7, 5], [ 8, 4, 3, 1], [ 6, 2, 1, 0]]) import matplotlib.pyplot as plt plt.imshow(a, interpolation='nearest') plt.colorbar() |
pyROOT では TTree tree の各エントリー event のある変数 x1 , x2 を得るとき,これでできる
|
1 2 |
for event in tree: print event.x1, event.x2 |
参考:
https://root.cern.ch/phpBB3/viewtopic.php?t=10962
 (0.00) (0.00) (0.00)


![\begin{align*} \frac{1}{2}\left[\cos x + \cos(x+\delta)\right] &= \cos(\delta/2)\cos(x + \delta/2) \end{align*}](https://n3956.net/blog/wp-content/ql-cache/quicklatex.com-06153d9fff23612b84b9b22e761175f2_l3.png "Rendered by QuickLaTeX.com")