
- matplotlib でヒストグラム化と描画(patchの作成)を同時に行う
|
1 2 3 4 5 6 7 8 9 10 11 |
import numpy as np import matplotlib.pyplot as plt # ヒストグラムに詰められるデータ列の作成 events = np.random.normal(loc=0.0, scale=1.0, size=100000) # matplotlib.pyplot.hist によるヒストグラムの作成 n, bins, patches = plt.hist(events, 20, range=(-4, 4), weights=None, normed=False, histtype="step", log=False) plt.show() |
- numpy で一旦ヒストグラムの配列を作成した後,matplotlib.plot.bar 等で描画
|
1 2 3 4 5 6 |
n, bins = np.histogram(events, bins=20, range=(-4, 4), normed=False, weights=None) plt.step(bins[:-1], n, where='post') # pyplot.bar や pyplot.step の引数はビンの下端なので,bins の最後の要素は除いて与える # step の場合は where に注意 plt.show() |
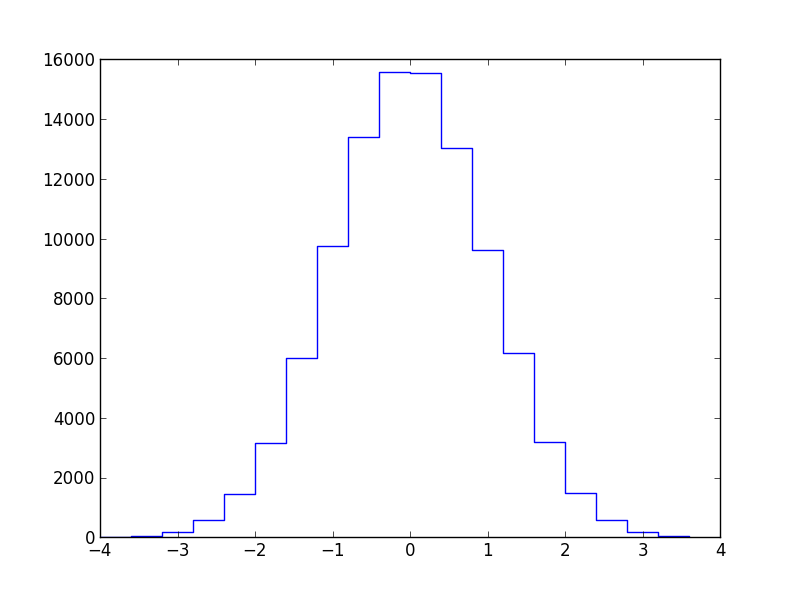
n, bins, events の中身
|
1 2 3 4 5 6 7 8 9 10 11 12 13 14 15 16 17 18 |
In [60]: len(events) Out[60]: 100000 In [61]: events Out[61]: array([-1.17002971, 0.27118956, -0.4475408 , ..., 1.56139502, 0.10611222, 1.72545906]) In [62]: n Out[62]: array([ 13, 40, 176, 569, 1462, 3142, 6004, 9749, 13409, 15560, 15539, 13032, 9629, 6151, 3202, 1476, 585, 184, 55, 18]) In [63]: bins Out[63]: array([-4. , -3.6, -3.2, -2.8, -2.4, -2. , -1.6, -1.2, -0.8, -0.4, 0. , 0.4, 0.8, 1.2, 1.6, 2. , 2.4, 2.8, 3.2, 3.6, 4. ]) |
