基本的に ROOT のヒストグラムならROOTの機能 (Draw) で描画して絵を得るのが素直ですが,python の方でいろいろと処理したい場合に便利?
ビンの下端の値をリストとして得る
[testh.GetBinLowEdge(i+1) for i in range(testh.GetNbinsX())]
ビンの中身をリストとして得る
[testh.GetBinContent(i+1) for i in range(testh.GetNbinsX())]
使用例
|
1 2 3 4 5 6 7 8 9 10 11 12 13 14 15 16 17 18 19 20 21 22 23 24 25 26 27 28 29 30 |
>>> testh = TH1F("testh", "testh title", 20, -1.0, 1.0) >>> testh.FillRandom("gaus", 100000) # mean=0, sigma=1 のガウス分布を 100000 サンプル >>> [testh.GetBinLowEdge(i+1) for i in range(testh.GetNbinsX())] [-1.0, -0.9, -0.8, -0.7, -0.6, -0.5, -0.3999999999999999, -0.29999999999999993, -0.19999999999999996, -0.09999999999999998, 0.0, 0.10000000000000009, 0.20000000000000018, 0.30000000000000004, 0.40000000000000013, 0.5, 0.6000000000000001, 0.7000000000000002, 0.8, 0.9000000000000001] >>> [testh.GetBinContent(i+1) for i in range(testh.GetNbinsX())] [0.0, 1.0, 20.0, 117.0, 444.0, 1670.0, 4427.0, 9067.0, 15108.0, 18890.0, 19146.0, 15026.0, 9332.0, 4509.0, 1651.0, 458.0, 111.0, 22.0, 1.0, 0.0] |
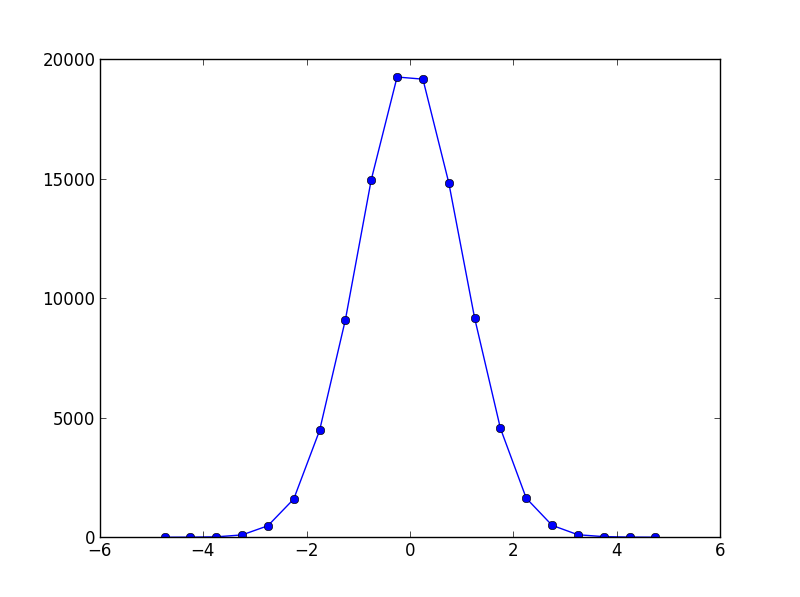
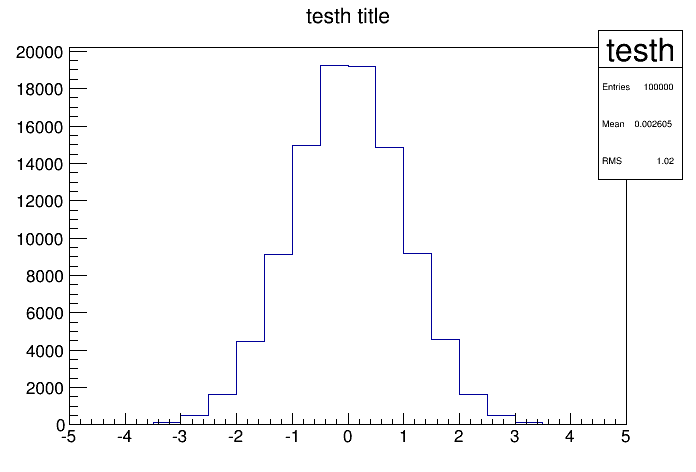
ROOT の Draw と matplotlib でプロットしてみる
|
1 2 3 4 |
>>> xp = [testh.GetBinCenter(i+1) for i in range(testh.GetNbinsX())] # ビンの中心値のリスト >>> yp = [testh.GetBinContent(i+1) for i in range(testh.GetNbinsX())] # ビンの値のリスト >>> plot(xp, yp, 'o-') # matplotlib でプロット >>> testh.Draw() # pyROOT で Draw |